Quantum GIS Service
Quantum proposes a solution that enables the planning and monitoring of infrastructure installation teams in the territory thanks to interactive maps. The system locates interventions via satellite in real time and is able to collect related statistical data. We store the data, process it and represent it.
Our goal is to significantly reduce time and costs, plan and manage activities in the field, digitise processes, mitigate risks, and represent in real time the progress of the work carried out in synchrony with the various operators.
How it works
We create customised software environments, supported by applications capable of supporting the entire project cycle and field operations, all without disrupting the existing IT infrastructure thanks to strong interoperability with CAD technology and compatibility with major standards, both vector and tabular:
- Field operators collect and report data, using dedicated applications;
- Engineers and managers create maps and plans, manage data and operators, using web applications capable of real-time data management;
- Key decision makers are always accurately informed about the progress of the work;
- End customers consult maps directly from the web.
Quantum’s services include:
- Needs analysis and assessment;
- Data creation, manipulation and implementation;
- Data modelling in a GIS environment;
- Data visualisation;
- Data analysis and reporting;
- Data collection, input and conversion;
- Digital mapping;
- Database design;
- Development of dedicated applications.
The Qlight Control System™

The system proposed by Quantum enables complete control of the lighting system via a hierarchically arranged network of interconnections (Smart Grid) that allows each individual lighting point to be remotely controlled according to predefined sensor inputs or profiles, alarms to be managed and consumption/savings to be reported.
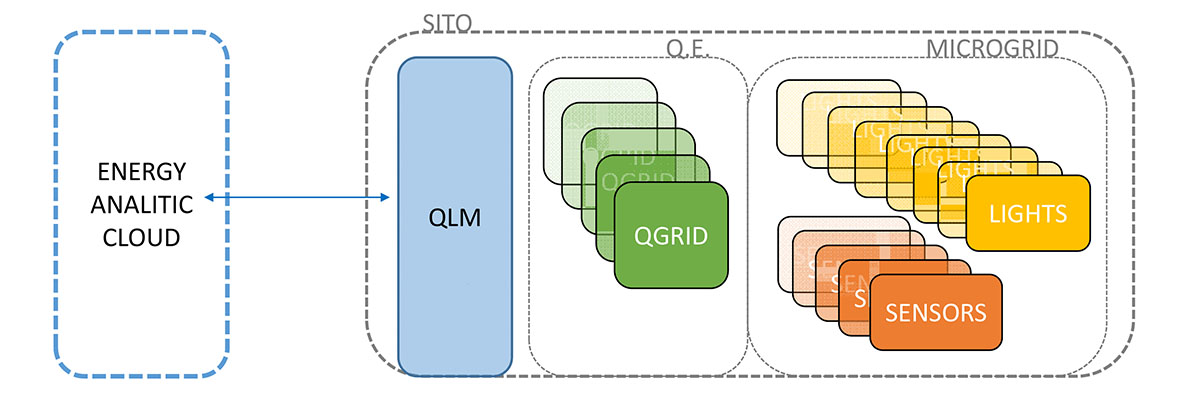
Point of Light Level: interconnected luminaire, which integrates the Software (Quantum Light Controller) within itself.
The luminaires all have their own intelligence and the ability to react to inputs from the QLight system’s physical level (switching on/off, dimming) and to behave accordingly, either individually or in groups, according to the scenarios programmed and synchronised with production activities.
Each luminaire is uniquely identified by a digital address that allows the software application to recognise its topology in the lighting system network and dynamically programme its behaviour in real time according to the actual activities taking place.
Switchboard level: a departmental control panel that, through the insertion of the Quantum Q-GRID™ module, builds and maintains connections with lighting fixtures and between different switchboards.
It represents the plant’s micro SmartGrid™ that allows Quantum’s solution to be interconnected and interact at the work centre, department, office, plant level. The set of QGrid modules, and therefore of the various departmental switchboards, represents the network of interconnection and information exchange between the lighting system and the software applications that govern its servicing of industrial processes.
Building/site level: at the plant level, the supervision of the individual network elements of the Quantum energy efficiency solution is realised via the Quantum Light Manager (QLM) gateway. The Light Manager interfaces with standard communication mode, the network of QGrid modules.
Quantum Energy Analytics Platform

Platform Architecture
Before the data is represented in the customer dashboard, it goes through several steps as described below:
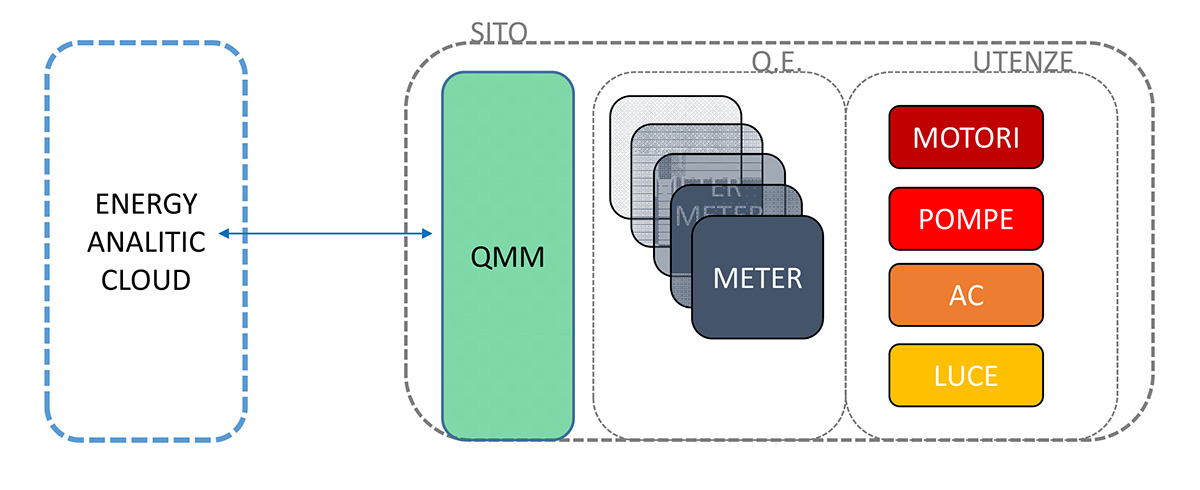
- Quantum Data Collection Engine: where data will be collected from the different units of the site and sent to a common gateway to the Data Warehouse
- Data Warehouse: the data collected from the site will be stored in the cloud where it will be analysed.
- Energy Analytics: this is the dashboard where the analysed data will be represented to the customer and M&V engineers.
Data collection
The cloud-based data centre is connected to the customer site via secure VPN communications.
Data is collected in real time from the customer site. This includes indicators such as electricity consumed and generated, water, gas, etc.
Other customer data can be collected and uploaded to the cloud. Examples are building occupancy, work shifts, production capacity, daily/hourly production, etc. Environmental data such as temperature, humidity, solar radiation and weather conditions can also be entered into the platform.
The platform is stand-alone and can work with either QuantumEsco or any supplier’s measurement solutions.
Data processing e reporting
- Pre-Processing
Data are normalised and cleaned in the pre-processing phase.
The raw meter data is always stored for transparency and available to the customer.
Data are pre-processed to compare measurements with baseline values to obtain energy-saving metrics.
- Base Line Adjustment
The EAP platform implements the IPMVP protocol for baseline adjustment. A dedicated IPMVP data entry menu allows the recording of events that have an impact on the agreed baseline, such as additional loads, change of occupation or working hours, etc. The customer is informed of the baseline change and must approve the baseline change.
- ESM forecasting behaviour
The EAP platform runs Artificial Intelligence functions based on BDL (Biderectional Link) and a ‘Knob-les’ data selection approach. The platform, according to the selected ESM, is fed with data from meters and sensors.
- Reporting
The reporting engine offers a rich data visualisation that allows customers and energy experts to quickly build a customised visualisation using the widget editor, which simplifies the way of analysing and correlating complex data.
Different reports are made available to customers according to their customised needs, as well as automated M&V reports.
Dedicated widgets help to build meaningful visualisations without specialised computer skills.
- Smart Alerting
The alarm engine monitors the expected behaviour of the ESM and based on the severity of the deviation, reacts with a predetermined risk assessment and user-defined escalation protocol.